The content of this document may be used and reprinted without permission except for the following: Federal Government logos, items noted with specific restrictions, and those copyrighted materials that are clearly noted in the document. Further reproduction of those copyrighted materials is prohibited without the specific permission of copyright holders.
The authors of this report are responsible for its content. Statements in the report should not be construed as endorsement by the Agency for Healthcare Research and Quality or the U.S. Department of Health and Human Services.
TABLE OF CONTENTS
1. EXECUTIVE SUMMARY
The Consumer Assessment of Healthcare Providers and Systems (CAHPS®) Health Plan Survey Database receives data voluntarily submitted by survey users that have administered the CAHPS Health Plan Survey. The CAHPS Database aggregates the data to facilitate comparisons of CAHPS survey results by users, researchers, and other interested organizations.
This Chartbook presents summary-level results submitted in 2017 for the CAHPS Health Plan Survey 5.0 version for the following health plan enrollee populations:
- Adult Medicaid
- Child Medicaid
- CHIP (Children's Health Insurance Program)
- Medicare Managed Care
Results for the core survey composites, individual question items, and ratings are presented in the form of bar charts. In addition, selected trend results for 10 years during the period from 2007-2017 are presented for the Adult and Child Medicaid and Medicare populations. (Note that no results are available for 2012 because of a lapse in the support contract for the CAHPS Database.) CHIP results are presented for six years.
Comparisons by Population
Table 1 presents a comparison of top-box scores (the most positive survey response option) for the composites and ratings across the four health plan enrollee populations included in the 2017 CAHPS Health Plan Survey Database.
Table 1. Comparison of 2017 Top-Box Scores By Enrollee Population
|
Composite/Rating
|
Adult
Medicaid |
Child
Medicaid |
CHIP |
Medicare |
| Composites |
|
|
|
|
| Getting Needed Care |
55%
|
61%
|
62%
|
63% |
| Getting Care Quickly |
59%
|
73%
|
74%
|
69%
|
| How Well Doctors Communicate |
74%
|
78%
|
79%
|
79%
|
| Health Plan Information and Customer Service |
68%
|
67%
|
66%
|
73%
|
| Ratings |
|
|
|
|
| Rating of Personal Doctor |
65%
|
75%
|
76%
|
78%
|
| Rating of Specialist |
66%
|
72%
|
72%
|
74%
|
| Rating of Health Care |
54%
|
68%
|
69%
|
62%
|
| Rating of Health Plan |
58%
|
69%
|
69%
|
62%
|
Highlights from Table 1 include the following:
- The highest scoring composite across all populations is How Well Doctors Communicate. The lowest scoring composite is Getting Needed Care.
-
The highest scoring rating is:
- Personal Doctor for the Child Medicaid, CHIP, and Medicare populations.
- Specialist for the Adult Medicaid population
-
The lowest scoring overall rating is:
- Health Care for the Adult and Child Medicaid populations
- Health Care and Health Plan for the CHIP and Medicare populations,
- Scores for the Child Medicaid and CHIP populations are higher than those for the Adult Medicaid population for all composites and ratings except for the Health Plan Information and Customer Service composite.
- Scores for the Medicare population are higher than those for the other populations for the Getting Needed Care composite and the Health Plan Information and Customer Service composite and the ratings for Personal Doctor and Specialist.
Comparisons Over Time
As shown in the trend graphs following the results presented for each enrollee population, there has been a steady improvement in scores for most composites and ratings across each population for the years available for reporting.
About the CAHPS Database
The summary results presented in this Chartbook are compiled from data reported in the CAHPS Database Online Reporting System (ORS) at https://www.cahpsdatabase.ahrq.gov/CAHPSIDB/Public/about.aspx.
De-identified research files for the CAHPS Health Plan Survey data presented in this Chartbook, as well as from the 2000-2016 CAHPS Health Plan Databases, are available upon request according to the CAHPS Database Data Release Policy. (To learn more, visit https://cahpsdatabase.ahrq.gov/DataResearchers.aspx.)
The CAHPS Health Plan Database Online Reporting System (ORS) is updated annually with new data submitted by CAHPS Health Plan survey users. Questions or comments regarding this Chartbook or any aspect of the CAHPS Health Plan Survey Database may be directed to the CAHPS Database toll-free help line at 888-808-7108 or by email to CAHPSDatabase@westat.com.
Back To Top
2. DATA SOURCES AND LIMITATIONS
The data presented in this Chartbook were compiled from CAHPS Health Plan Survey results submitted to the CAHPS Database by various survey sponsors, including State Medicaid agencies, CHIP programs, individual health plans, and the Medicare program.
Data Sources
-
Medicaid Data and CHIP Data: The survey results for the Medicaid and CHIP populations were obtained from data submitted directly to the CAHPS Database by State Medicaid agencies and individual health plans. The 2017 results are based on survey data collected between September 2016 and June 2017.
-
Medicare Data : Each year, the CAHPS Database receives the CAHPS Medicare Managed Care survey data collected by the Centers for Medicare & Medicaid Services (CMS). These results are for survey participants enrolled in a managed care health plan including both enrollees receiving prescription drug coverage through their health plan and those that do not receive prescription drug coverage through their health plan. The Medicare results presented here may differ from other reports because of the inclusion or exclusion of certain beneficiary groups and/or the use of case-mix adjustment variables. The survey data were collected from March through June 2017.
Appendix A presents the number of Medicaid, CHIP, and Medicare survey respondents by State included in the 2017 CAHPS Health Plan Survey Database.
Data Limitations
Because the organizations that voluntarily contribute data to the CAHPS Database are not from a statistically representative sample of all U.S. health plans,
and a limited number of plans may choose to participate, the submitting organizations are not representative of all U.S. health plans or enrollee populations1.
Estimates based on these voluntarily submitted data sets may produce biased estimates of the U.S. health plan and enrollee populations; it is not possible to compute estimates of precision from these data. In addition, the number and mix of sponsors contributing data vary slightly from year to year, and therefore comparisons over time should be made with these limitations and variations in mind. Comparisons of results across populations should also take into account that variations in benefit design and other factors might affect survey responses across populations.
1 The Medicare results are based on a representative sample of all Medicare Advantage health plans.
Back To Top
3. RESULTS BY ENROLLEE POPULATION
This section presents a summary of results for each of the health plan enrollee populations included in the 2017 CAHPS Health Plan Survey Database. Results are presented in the form of bar charts that graphically show the distribution of scores for the four composites, the individual question items that compose each composite, and the four ratings. Appendix B lists the composites, individual items, and ratings for the 5.0 version of the CAHPS Health Plan Survey.
The bar charts are composed of colored segments that show the percentage of responses in each of the response categories. For questions and composites based on 4-point response scales (i.e., "always", "usually", "sometimes", "never"), the left-most segment combines the two lowest response categories (i.e., "sometimes" and "never").
All results presented in these charts are calculated at the respondent level. Survey results are presented in the following order:
-
Adult Medicaid
-
Child Medicaid
-
CHIP
-
Medicare
To provide context for the 2017 results, the percentage distribution of survey respondents by State for each population is shown graphically at the beginning of each section. The actual number of respondents by State is shown in Appendix A.
Trend data for the Adult and Child Medicaid and Medicare enrollee populations are presented for 2007 to 2017. Trend data for the CHIP enrollee population are presented for 2011 to 2017. The contract that supports the Consumer Assessment of Healthcare Providers and Systems (CAHPS) program expired during 2012, and a new contract was awarded in 2013; therefore, the CAHPS Database does not include CAHPS Health Plan Survey data for 2012.
Although the number and mix of health plans within each enrollee population vary slightly from year to year, there has been a fairly consistent level of participation during this time span within the Adult Medicaid, Child Medicaid, and Medicare populations. The number of plans and respondents shown in each table provides some indication of the variation in the data sources from year to year. And although the CAHPS Health Plan Survey instrument changed slightly during this period with the transition from the 4.0 to the 5.0 version, changes to individual question items were very minor, and there were no changes in the rating questions or the definition of the composites.
As noted earlier, detailed results for each question item are available through the CAHPS Database Online Reporting System at https://www.cahpsdatabase.ahrq.gov/CAHPSIDB/Public/about.aspx
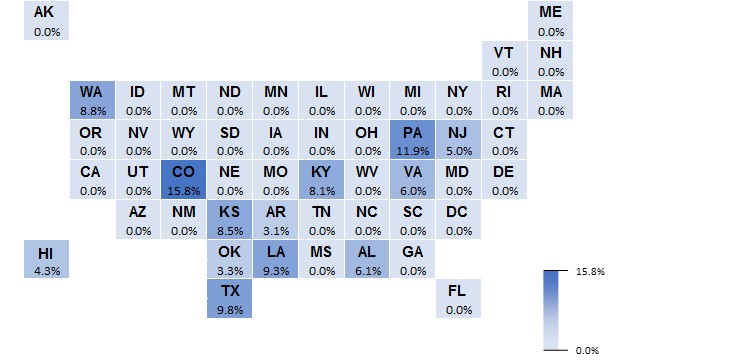
Adult Medicaid
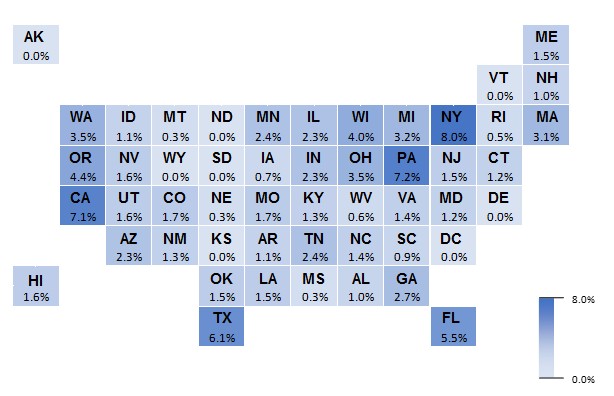
Percentage Distribution of 2017 Survey Respondents by State
Adult Medicaid
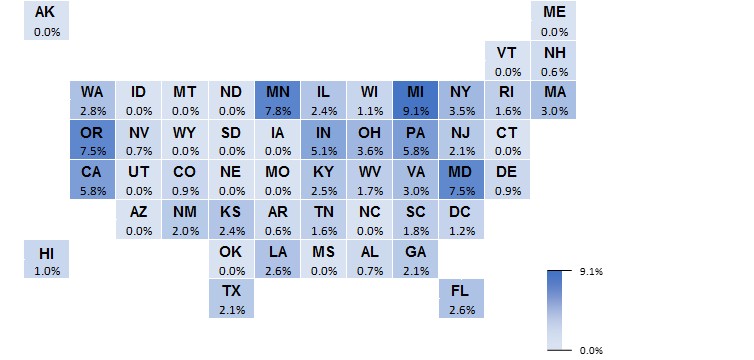 Heat map showing percentage distribution of 2017 Adult Medicaid respondents by state in descending order
.
Adult Medicaid 2017 Results
|
| Composite/Item | | Never + Sometimes | Usually | Always |
|  |
|
|
|
|
|
N |
|
| Getting Needed Care Composite | | | |
|
49,957 |
|
| How often was easy to get needed care, tests, or treatment | | | |
|
47,373 |
|
| Got appointments with specialists as soon as needed | | | |
|
26,274 |
|
|
N |
|
| Getting Care Quickly Composite | | | |
|
49,381 |
|
| Got urgent care for illness, injury or condition as soon as needed | | | |
|
25,789 |
|
| Got routine appointment at doctor's office or clinic as soon as needed | | | |
|
44,652 |
|
|
N |
|
| How Well Doctors Communicate Composite | | | |
|
40,846 |
|
| Personal doctor explained things clearly | | | |
|
40,669 |
|
| Personal doctor listened carefully | | | |
|
40,588 |
|
| Personal doctor respected consumer comments | | | |
|
40,565 |
|
| Personal doctor spent enough time with consumers | | | |
|
40,494 |
|
Adult Medicaid 2017 Results (continued)
|
| Composite/Item | | Never + Sometimes | Usually | Always |
| |
|
|
|
|
|
N |
|
| Health Plan Information and Customer Service Composite | | | |
|
20,380 |
|
| Customer service gave necessary information or help | | | |
|
20,249 |
|
| Customer service staff courteous and respectful | | | |
|
20,207 |
|
|
| Rating | | |
|
|
|
|
|
N |
|
| Overall Rating of Personal Doctor | | | |
|
49,723 |
|
| Overall Rating of Specialist | | | |
|
24,794 |
|
| Overall Rating of Health Care | | | |
|
47,534 |
|
| Overall Rating of Health Plan | | | |
|
61,459 |
|
Back To Top
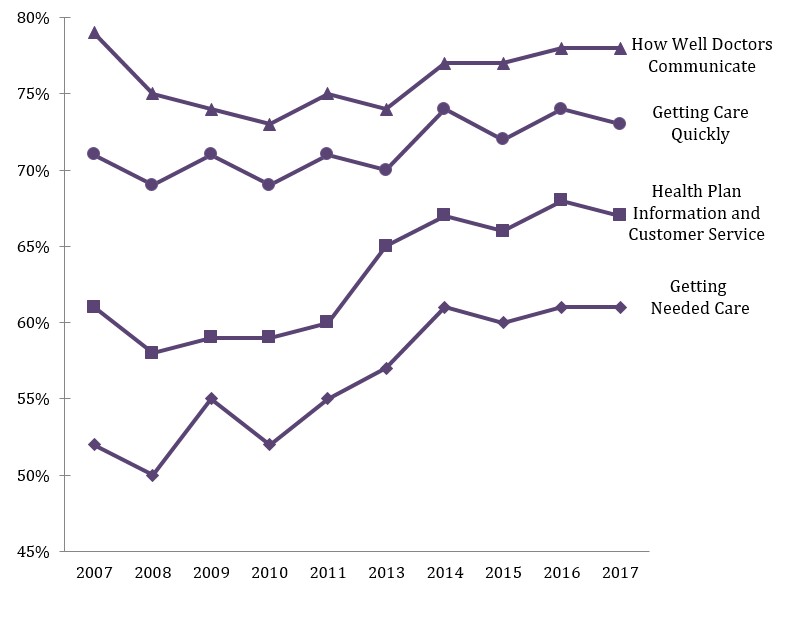
Adult Medicaid Trends
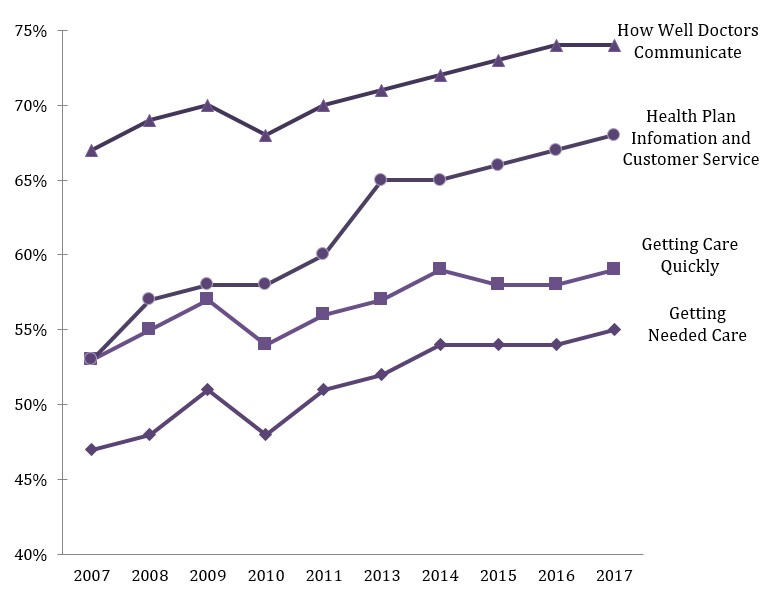
Line graph depicting Adult Medicaid top-box composite scores over time.
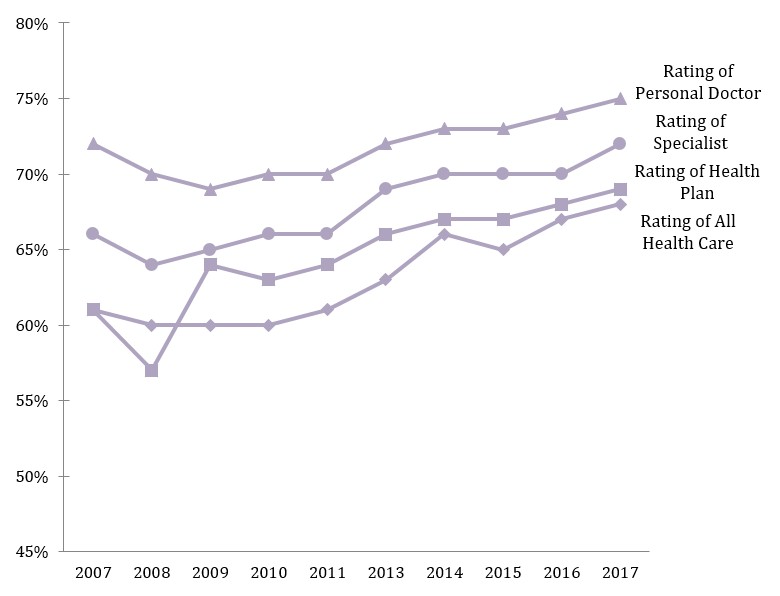
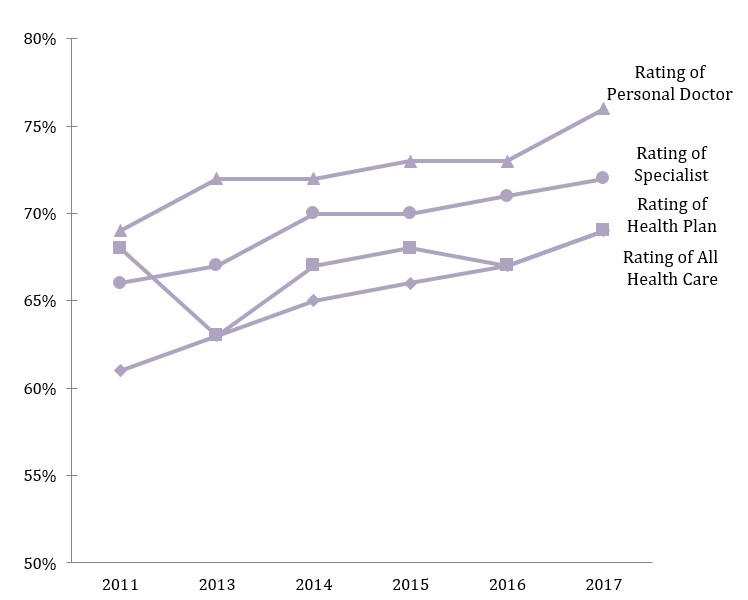
Adult Medicaid Trends (continued)
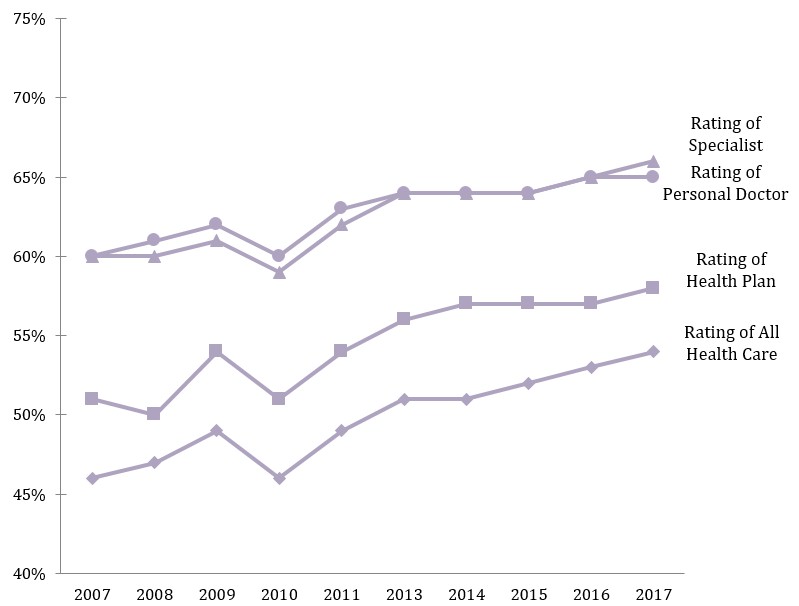
Line graph depicting Adult Medicaid top-box rating scores over time.
Table 2. Adult Medicaid Composition of the CAHPS Health Plan Survey Database 2007-2017
|
Adult Medicaid Composition |
|
2007 |
2008 |
2009 |
2010 |
2011 |
2013 |
2014 |
2015 |
2016 |
2017 |
| Number of Plans |
109
|
120
|
126
|
186
|
148
|
124
|
149
|
133
|
157
|
152
|
| Number of Respondents |
45,979
|
59,840
|
63,391
|
97,626
|
73,820
|
60,249
|
68,234
|
61,369
|
73,155
|
65,053
|
Notes: (1) From 2007-2011, the Database reported Adult Medicaid version 4.0. (2) From 2013-2017, the Database reported version 5.0 for Adult Medicaid.
Back To Top
Child Medicaid
Percentage Distribution of 2017 Survey Respondents by State
Child Medicaid
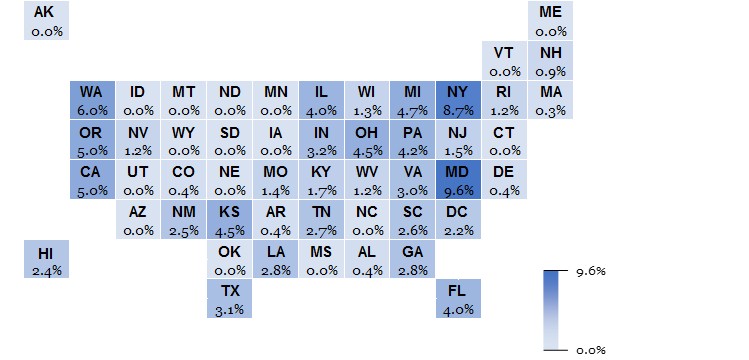
Heat map showing percentage distribution of 2017 Child Medicaid respondents by state in descending order .
Child Medicaid 2017 Results
|
| Composite/Item | | Never + Sometimes | Usually | Always |
| |
|
|
|
|
|
N |
|
| Getting Needed Care for a Child Composite | | | |
|
77,803 |
|
| How often was easy to get needed care, tests or treatment for child | | | |
|
74,883 |
|
| Got appointments with specialists for child as soon as needed | | | |
|
22,753 |
|
|
N |
|
| Getting Care Quickly for a Child Composite | | | |
|
80,503 |
|
| Child got urgent care for illness, injury or condition as soon as wanted | | | |
|
35,441 |
|
| Got routine appointment at doctor's office or clinic for child as soon as needed | | | |
|
73,872 |
|
|
N |
|
| How Well the Child's Doctors Communicate Composite | | | |
|
69,360 |
|
| Child's personal doctor explained things clearly | | | |
|
69,110 |
|
| Child's personal doctor listened carefully | | | |
|
68,992 |
|
| Child's personal doctor respected consumer comments | | | |
|
68,913 |
|
| Child's personal doctor explained things in a way that was easy for child to understand | | | |
|
46,334 |
|
| Child's personal doctor spent enough time with child | | | |
|
68,323 |
|
Child Medicaid 2017 Results (continued)
|
| Composite/Item | | Never + Sometimes | Usually | Always |
| |
|
|
|
|
|
N |
|
| Health Plan Information and Customer Service Composite | | | |
|
29,989 |
|
| Customer service at child's health plan gave information or help needed | | | |
|
29,791 |
|
| Customer service staff at child's health plan courteous and respectful | | | |
|
29,724 |
|
|
| Rating | | |
|
|
|
|
|
N |
|
| Overall Rating of Child's Personal Doctor | | | |
|
85,952 |
|
| Overall Rating of Child's Specialist | | | |
|
21,094 |
|
| Overall Rating of Child's Health Care | | | |
|
74,996 |
|
| Overall Rating of Child's Health Plan | | | |
|
96,824 |
|
Back To Top
Child Medicaid Trends
Line graph depicting Child Medicaid top-box composite scores over time.
Child Medicaid Trends (continued)
Line graph depicting Child Medicaid top-box rating scores over time.
Table 3. Child Medicaid Composition of the CAHPS Health Plan Survey Database 2007-2017
|
Child Medicaid Composition |
|
2007 |
2008 |
2009 |
2010 |
2011 |
2013 |
2014 |
2015 |
2016 |
2017 |
| Number of Plans |
16
|
29
|
107
|
132
|
129
|
105
|
100
|
136
|
132
|
169
|
| Number of Respondents |
4,647
|
9,755
|
68,697
|
88,694
|
85,003
|
66,804
|
60,153
|
91,049
|
79,058
|
103,283
|
Notes: (1) From 2007-2011, the Database reported Child Medicaid version 4.0. (2) From 2013-2017, the Database reported version 5.0 for Child Medicaid.
Back To Top
Children’s Health Insurance Program (CHIP)
Percentage Distribution of 2017 Survey Respondents by State
Children’s Health Insurance Program (CHIP)
Heat map showing percentage distribution of 2017 Children’s Health Insurance Program (CHIP) respondents by state in descending order .
CHIP 2017 Results
|
| Composite/Item | | Never + Sometimes | Usually | Always |
| |
|
|
|
|
|
N |
|
| Getting Needed Care for a Child Composite | | | |
|
11,317 |
|
| How often was easy to get needed care, tests or treatment for child | | | |
|
10,951 |
|
| Got appointments with specialists for child as soon as needed | | | |
|
3,195 |
|
|
N |
|
| Getting Care Quickly for a Child Composite | | | |
|
11,392 |
|
| Child got urgent care for illness, injury or condition as soon as wanted | | | |
|
5,228 |
|
| Got routine appointment at doctor's office or clinic for child as soon as needed | | | |
|
10,134 |
|
|
N |
|
| How Well the Child's Doctors Communicate Composite | | | |
|
9,833 |
|
| Child's personal doctor explained things clearly | | | |
|
9,810 |
|
| Child's personal doctor listened carefully | | | |
|
9,786 |
|
| Child's personal doctor respected consumer comments | | | |
|
9,775 |
|
| Child's personal doctor explained things in a way that was easy for child to understand | | | |
|
7,193 |
|
| Child's personal doctor spent enough time with child | | | |
|
9,699 |
|
CHIP 2017 Results (continued)
|
| Composite/Item | | Never + Sometimes | Usually | Always |
| |
|
|
|
|
|
N |
|
| Health Plan Information and Customer Service Composite | | | |
|
4,112 |
|
| Customer service at child's health plan gave information or help needed | | | |
|
4,097 |
|
| Customer service staff at child's health plan courteous and respectful | | | |
|
4,087 |
|
|
| Rating | | |
|
|
|
|
|
N |
|
| Overall Rating of Child's Personal Doctor | | | |
|
12,617 |
|
| Overall Rating of Child's Specialist | | | |
|
2,997 |
|
| Overall Rating of Child's Health Care | | | |
|
10,983 |
|
| Overall Rating of Child's Health Plan | | | |
|
14,447 |
|
CHIP Trends
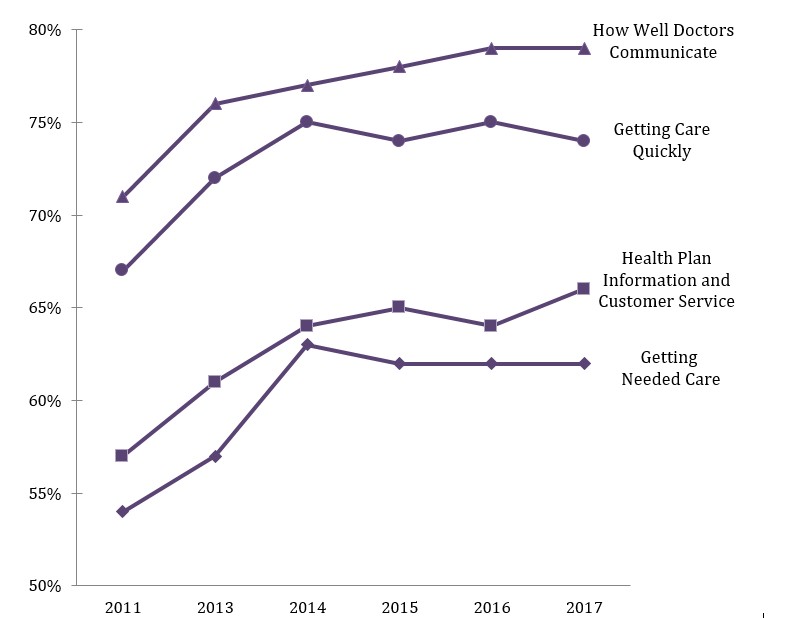
Line graph depicting chip top-box composite scores over time.
CHIP Trends (continued)
Line graph depicting chip top-box rating scores over time.
Table 4. CHIP Composition of the CAHPS Health Plan Survey Database 2011-2017
|
CHIP Medicaid Composition |
|
|
2011 |
2013 |
2014 |
2015 |
2016 |
2017 |
| Number of Plans |
41
|
12
|
15
|
19
|
21
|
23
|
| Number of Respondents |
26,232
|
9,149
|
11,762
|
13,466
|
14,999
|
15,221
|
Notes: (1) In 2011, the Database reported CHIP Medicaid version 4.0. (2) From 2013-2017, the Database reported version 5.0 for CHIP Medicaid.
Back To Top
Medicare
Percentage Distribution of 2017 Survey Respondents by State
Medicare
Graph Depicting Percentage Distribution of 2017 Survey Respondents by Statee.
Medicare 2017 Results
|
| Composite/Item | | Never + Sometimes | Usually | Always |
| |
|
|
|
|
|
N |
|
| Getting Needed Care Composite | | | |
|
188,565 |
|
| How often was easy to get needed care, tests, or treatment through health plan | | | |
|
186,552 |
|
| How often was easy to get appointments with specialists | | | |
|
115,483 |
|
|
N |
|
| Getting Appointments and Care Quickly Composite | | | |
|
160,960 |
|
| Got urgent care for illness, injury or condition as soon as needed | | | |
|
66,143 |
|
| Got non-urgent appointment at doctor's office or clinic as soon as thought needed | | | |
|
152,574 |
|
|
N |
|
| Doctors Who Communicate Well Composite | | | |
|
157,809 |
|
| Personal doctor explained things clearly | | | |
|
157,157 |
|
| Personal doctor listened carefully | | | |
|
157,142 |
|
| Personal doctor respected consumer comments | | | |
|
157,151 |
|
| Personal doctor spent enough time with consumers | | | |
|
156,905 |
|
Medicare 2017 Results (continued)
|
| Composite/Item | | Never + Sometimes | Usually | Always |
| |
|
|
|
|
|
N |
|
| Customer Service Composite | | | |
|
84,422 |
|
| Customer service gave information or help needed | | | |
|
83,229 |
|
| Customer service staff courteous and respectful | | | |
|
83,781 |
|
|
| Rating | | |
|
|
|
|
|
N |
|
| Overall Rating of Personal Doctor | | | |
|
156,610 |
|
| Overall Rating of Specialist | | | |
|
115,689 |
|
| Overall Rating of Health Care Quality | | | |
|
187,581 |
|
| Rating of Health Plan | | | |
|
185,630 |
|
Medicare Trends
*Data not available for 2007 Health Plan Information and Customer Service composite.
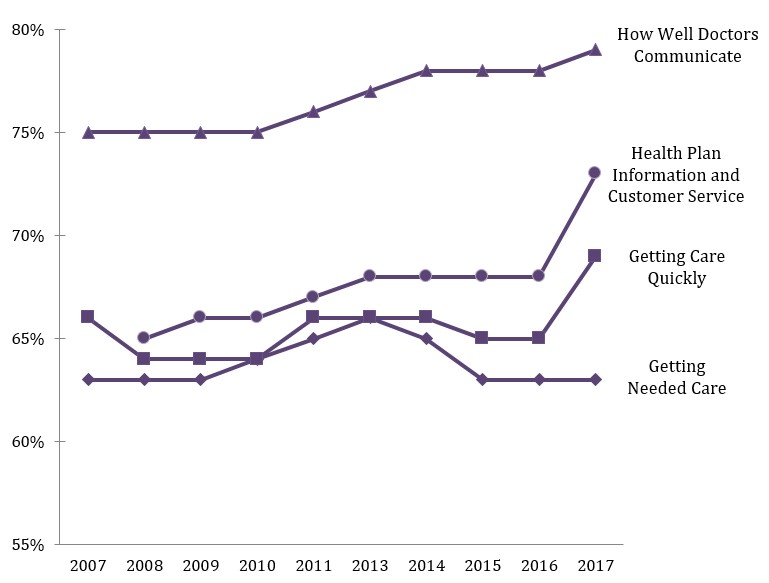
Line graph depicting Medicare top-box composite scores over time.
Medicare Trends (continued)
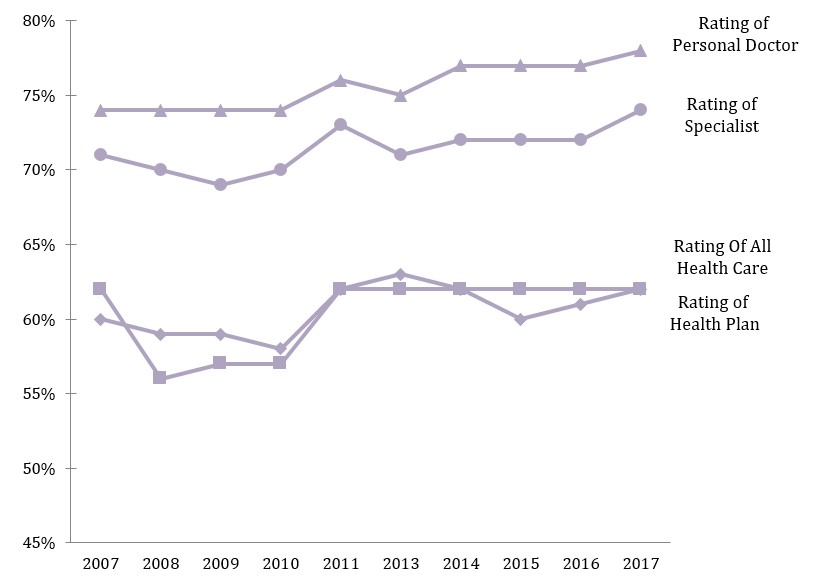
Line graph depicting Medicare top-box rating scores over time.
Table 5. Medicare Composition of the CAHPS Health Plan Survey Database 2007-2017
|
Medicare Composition |
|
2007 |
2008 |
2009 |
2010 |
2011 |
2013 |
2014 |
2015 |
2016 |
2017 |
| Number of Plans |
296
|
343
|
405
|
431
|
445
|
451
|
443
|
431
|
382
|
397
|
| Number of Respondents |
115,910
|
207,366
|
206,647
|
221,120
|
163,182
|
198,350
|
195,748
|
155,095
|
147,908
|
194,916
|
Note: (1) From 2007-2017, the Database collected Medicare version 4.0 only
APPENDIX A. 2017 SURVEY RESPONDENTS BY STATE
Table A-1 shows data submissions to the CAHPS Health Plan Survey Database by State for 2017. The total number of respondents by state are presented by population.
Table A-1. 2017 Survey Respondents by State
|
State
|
Adult Medicaid |
Child Medicaid |
CHIP |
Adult Medicare |
| Adult |
Child |
Child |
Adult |
| Alabama |
446
|
445
|
922
|
1,857
|
| Arizona |
- |
- |
- |
4,293 |
| Arkansas |
410 |
404 |
479 |
2,107 |
| California |
3,752 |
5,116 |
- |
13,440 |
| Colorado |
613 |
364 |
2,412 |
3,256 |
| Connecticut |
- |
- |
- |
2,350 |
| Delaware |
584 |
421 |
- |
- |
| District Of Columbia |
790 |
2,312 |
- |
- |
| Florida |
1,723 |
4,083 |
- |
10,514 |
| Georgia |
1,387 |
2,847 |
- |
5,076 |
| Hawaii |
652 |
2,510 |
659 |
3,006 |
| Idaho |
- |
- |
- |
2,140 |
| Illinois |
1,591 |
4,131 |
- |
4,451 |
| Indiana |
3,320 |
3,336 |
- |
4,420 |
| Iowa |
- |
- |
- |
1,286 |
| Kansas |
1,590 |
4,684 |
1,294 |
- |
| Kentucky |
1,619 |
1,806 |
1,226 |
2,385 |
| Louisiana |
1,692 |
2,885 |
1,416 |
2,947 |
| Maine |
- |
- |
- |
2,878 |
| Maryland |
4,895 |
9,952 |
- |
2,361 |
| Massachusetts |
1,931 |
314 |
- |
5,861 |
| Michigan |
5,937 |
4,881 |
- |
6,007 |
| Minnesota |
5,093 |
- |
- |
4,481 |
| Mississippi |
- |
- |
- |
602 |
| Missouri |
- |
1,439 |
- |
3,192 |
| Montana |
- |
- |
- |
663 |
| Nebraska |
- |
- |
- |
653 |
| Nevada |
481 |
1,274 |
- |
3,021 |
| New Hampshire |
374 |
926 |
- |
1,972 |
| New Jersey |
1,353 |
1,583 |
758 |
2,882 |
| New Mexico |
1,300 |
2,606 |
- |
2,498 |
| New York |
2,260 |
8,974 |
- |
15,264 |
| North Carolina |
- |
- |
- |
2,601 |
| Ohio |
2,372 |
4,688 |
- |
6,661 |
| Oklahoma |
- |
- |
501 |
2,945 |
| Oregon |
4,906 |
5,149 |
- |
8,424 |
| Pennsylvania |
3,771 |
4,365 |
1,817 |
13,777 |
| Puerto Rico |
- |
- |
- |
4,524 |
| Rhode Island |
1,050 |
1,274 |
- |
972 |
| South Carolina |
1,160 |
2,712 |
- |
1,803 |
| Tennessee |
1,045 |
2,791 |
- |
4,576 |
| Texas |
1,387 |
3,154 |
1,491 |
11,630 |
| Utah |
- |
- |
- |
3,031 |
| Vermont |
- |
- |
- |
- |
| Virginia |
1,971 |
3,091 |
908 |
2,614 |
| Washington |
1,793 |
6,195 |
1,338 |
6,730 |
| West Virginia |
1,111 |
1,273 |
- |
1,112 |
| Wisconsin |
694 |
1,298 |
- |
7,653 |
| Totals |
65,053 |
103,283 |
15,221 |
194,916 |
Back To Top
APPENDIX B. DEFINITION OF COMPOSITES, ITEMS AND RATINGS
The following tables present the composites and individual items and ratings for the 5.0 Adult Medicaid and Child versions of the CAHPS Health Plan Survey.
Table B-1. Adult Medicaid Composites and Rating Items for 5.0 Version of CAHPS Health Plan Survey
|
Question Text
|
Response Option
|
| Getting Needed Care |
|
| In the last 6 months, how often did you get an appointment to see a specialist as soon as you needed? |
Response Options
- Never
- Sometimes
- Usually
- Always
|
| In the last 6 months, how often was it easy to get the care, tests, or treatment you needed? |
| Getting Care Quickly |
|
| In the last 6 months, when you needed care right away, how often did you get care as soon as you needed? |
Response Options
- Never
- Sometimes
- Usually
- Always
|
| In the last 6 months, how often did you get an appointment for a check-up or routine care at a doctor's office or clinic as soon as you needed? |
| How Well Doctors Communicate |
|
|
In the last 6 months, how often did your personal doctor explain things in a way that was easy to understand?
|
Response Options
- Never
- Sometimes
- Usually
- Always
|
|
In the last 6 months, how often did your personal doctor listen
carefully to you?
|
|
In the last 6 months, how often did your personal doctor show
respect for what you had to say?
|
|
In the last 6 months, how often did your personal doctor spend
enough time with you?
|
| Health Plan Information & Customer Service |
|
| In the last 6 months, how often did your health plan’s customer service give you the information or help you needed? |
Response Options
- Never
- Sometimes
- Usually
- Always
|
| In the last 6 months, how often did your health plan’s customer service staff treat you with courtesy and respect? |
| Overall Ratings |
|
|
Using any number from 0 to 10, where 0 is the worst health care possible and 10 is the best health care possible, what number would you use to rate all your health care in the last 6 months?
|
Response Options
|
| Using any number from 0 to 10, where 0 is the worst personal doctor possible and 10 is the best personal doctor possible, what number would you use to rate your personal doctor? |
|
Using any number from 0 to 10, where 0 is the worst specialist possible and 10 is the best specialist possible, what number would you use to rate the specialist?
|
| Using any number from 0 to 10, where 0 is the worst health plan possible and 10 is the best health plan possible, what number would you use to rate your health plan? |
Back To Top
Table B-2. Child Medicaid and CHIP Composites and Rating Items for 5.0 Version of CAHPS Health Plan Survey
|
Question Text
|
Response Option
|
| Getting Needed Care |
|
| In the last 6 months, how often was it easy to get the care, tests, or treatment your child needed? |
Response Options
- Never
- Sometimes
- Usually
- Always
|
| In the last 6 months, how often did you get an appointment for your child to see a specialist as soon as you needed? |
| Getting Care Quickly |
|
| In the last 6 months, when your child needed care right away, how often did your child get care as soon as he or she needed? |
Response Options
- Never
- Sometimes
- Usually
- Always
|
| In the last 6 months, when you made an appointment for a check-up or routine care for your child at a doctor's office or clinic, how often did you get an appointment as soon as your child needed? |
| How Well Doctors Communicate |
|
|
In the last 6 months, how often did your child’s personal doctor explain things about your child’s health in a way that was easy to understand?
|
Response Options
- Never
- Sometimes
- Usually
- Always
|
|
In the last 6 months, how often did your child’s personal doctor listen carefully to you?
|
|
In the last 6 months, how often did your child’s personal doctor show respect for what you had to say?
|
|
In the last 6 months, how often did your child’s personal doctor explain things in a way that was easy for your child to understand?
|
|
In the last 6 months, how often did your child’s personal doctor spend enough time with your child?
|
| Health Plan Information & Customer Service |
|
| In the last 6 months, how often did customer service at your child’s health plan give you the information or help you needed? |
Response Options
- Never
- Sometimes
- Usually
- Always
|
| In the last 6 months, how often did customer service staff at your child’s health plan treat you with courtesy and respect? |
| Overall Ratings |
|
|
Using any number from 0 to 10, where 0 is the worst personal doctor possible and 10 is the best personal doctor possible, what number would you use to rate your child’s personal doctor?
|
Response Options
|
| Using any number from 0 to 10, where 0 is the worst personal doctor possible and 10 is the best personal doctor possible, what number would you use to rate your child’s specialist? |
|
Using any number from 0 to 10, where 0 is the worst health care possible and 10 is the best health care possible, what number would you use to rate all your child’s health care in the last 6 months?
|
| Using any number from 0 to 10, where 0 is the worst health plan possible and 10 is the best health plan possible, what number would you use to rate your child’s health plan? |
Back To Top