2015 CAHPS Clinician & Group Survey Database
2015 Chartbook: What Patients Say About Their Health Care Providers and Medical Practices
AHRQ Contract No.: HHSA290201300003C
Managed and prepared by:
Westat, Rockville, MD
Dale Shaller
Naomi Yount
John Rauch
Stephanie Li
Michael Corrothers
AHRQ Publication No. 16-CAHPS002-EF
July 2016
The content of this document may be used and reprinted without permission except for the following: Federal Government logos, items noted with specific restrictions, and those copyrighted materials that are clearly noted in the document. Further reproduction of those copyrighted materials is prohibited without the specific permission of copyright holders.
No investigators have any affiliations or financial involvement (e.g., employment, consultancies, honoraria, stock options, expert testimony, grants or patents received or pending, or royalties) that conflict with material presented in this report.
The authors of this report are responsible for its content. Statements in the report should not be construed as endorsement by the Agency for Healthcare Research and Quality or the U.S. Department of Health and Human Services.
Table of contents
1. EXECUTIVE SUMMARY
This Chartbook presents comparative results from the 2015 CAHPS Clinician & Group Survey (CG-CAHPS) Database for the following CG-CAHPS Survey versions:
- Adult Survey 2.0 Combined: Combined results from the 12-month and 6-month Adult 2.0 Core Survey combined with the core questions from the 12-month and 6-month Adult 2.0 Survey with Patient-Centered Medical Home (PCMH) Supplemental Items. The results also include the PCMH supplemental composites and items.
- Child Survey 2.0 Combined: Combined results from the 12-month and 6-month Child 2.0 Core Survey combined with the core questions from the 12-month and 6-month Child 2.0 Survey with Patient-Centered Medical Home (PCMH) Supplemental Items. The results also include the PCMH supplemental composites and items.
- Adult Visit Survey 2.0
- Adult Survey 3.0
Results are presented for each survey version in the form of bar charts that show the overall national distribution of scores at the respondent level. For selected survey versions with sufficient data, results also are presented by State and provider specialty. Trend data for available years are presented for each version except for the Adult Survey 3.0, since 2015 was the first year of data collection for this new survey version.
Selected highlights of the results presented in this Chartbook include the following:
- The highest scoring core survey composite in three of the four survey versions is "How Well Providers Communicate with Patients" (Provider Communication). The lowest scoring core survey composite is "Getting Timely Appointments, Care, and Information" (Access).
- Scores for all of the 2.0 survey versions generally remained stable or increased slightly over time.
- Across provider specialties, Cardiology and Hematology/Oncology have among the highest scores for all composite measures for the Adult Survey 2.0 Combined and Adult Visit Survey 2.0 versions.
The summary results presented in this Chartbook are compiled from detailed data displays available in the CG-CAHPS Database Online Reporting System (ORS) at https://www.cahpsdatabase.ahrq.gov/CAHPSIDB/Public/CG/CG_About.aspx
The CG-CAHPS Database ORS consists of both a public site and a private submitter’s site that is available only to survey users that contribute data. Survey users that submit data to the CG-CAHPS Database are provided access to a secure, password-protected area of the ORS that allows them to compare their own results to selected benchmarks. Both the public site and the submitter’s site present CG-CAHPS results for composite measures, ratings, and individual survey items, organized according to survey version and field period. Displays available through the various tabs of the ORS include “top box” scores, frequencies, bar charts, and percentiles. The “report builder” feature allows users to create and download custom reports on demand.
Research files for the CG-CAHPS data presented in this Chartbook, as well as from previous years, are available upon request according to the CAHPS Database Data Release Policy. (To learn more, visit https://www.cahpsdatabase.ahrq.gov/DataResearchers.aspx)
The CG-CAHPS Database Online Reporting System is updated periodically with new data submitted by CAHPS Clinician & Group survey users. Questions or comments regarding this Chartbook or any aspect of the CG-CAHPS Survey Database may be directed to the CAHPS Database toll-free help line at 888-808-7108 or by email to CAHPSDatabase@westat.com.
Back To Top
2. 2015 CG-CAHPS DATABASE COMPOSITION
The 2015 CG-CAHPS Database includes a total of 636,468 patient experience survey responses submitted voluntarily by 2,829 unique medical practices.
As shown in Table 1, the Adult Survey 2.0 Combined data represents the largest volume of data (with 418,901 respondents), followed by the Adult Visit Survey 2.0 (with 166,266 respondents). The Child Survey 2.0 Combined (26,364 respondents) and Adult Survey 3.0 (24,937 respondents) are significantly smaller. Because the new CG-CAHPS 3.0 version was released in July 2015, this represents only the first year of limited data collection for the Adult version of the survey. Data submitted for all survey versions were collected from January 2015 through March 2016.
Table 1. Composition of the 2015 CG-CAHPS Database
|
Survey Version
|
CG-CAHPS Database |
|
Number of Practice Sites
|
Number of Respondents |
| Adult Survey 2.0 Combined |
1,935
|
418,901
|
| Child Survey 2.0 Combined |
247
|
26,364
|
| Adult Visit Survey 2.0 |
490
|
166,266
|
| Adult Survey 3.0 |
157
|
24,937
|
| Total |
2,829
|
636,468
|
Data collected with the 2.0 version of the survey (excluding the Visit version) include surveys using the 6-month and 12-month reference period, as well as surveys that did or did not include PCMH supplemental items. In order to create the most comprehensive set of comparative results possible from the various versions of CG-CAHPS that were submitted, results for the 6-month core survey results have been combined with the 12-month core survey results for versions with and without the PCMH supplemental items.
The number of survey respondents and practice sites submitting the 12-month and 6-month surveys with and without the PCMH items in 2015 is shown in Table 2. Because some practices used both the Adult core survey and the Adult core survey with PCMH supplemental items, the total number of unique practice sites is shown in the Total column.
Table 2. Number of 2015 Respondents and Practice Sites by 12-month vs. 6-month Survey Versions
|
Survey Version
|
12-Month |
6-Month |
Total |
|
Number of Practice Sites
|
Number of Respondents |
Number of Practice Sites |
Number of Respondents |
Number of Practice Sites |
Number of Respondents |
| Adult |
589
|
137,752
|
875
|
156,563
|
1,424
|
294,315
|
| Adult PCMH |
209
|
45,060
|
409
|
79,526
|
618
|
124,586
|
| Total Adult 2.0 Combined |
798
|
182,812
|
1,284
|
236,089
|
1,935*
|
418,901
|
| Child |
22
|
3,913
|
143
|
9,895
|
164
|
13,808
|
| Child PCMH |
35
|
4,588
|
52
|
7,968
|
87
|
12,556
|
| Total Child 2.0 Combined |
57
|
8,501
|
195
|
17,863
|
247*
|
26,364
|
* These totals display the number of unique practice sites.
Back To Top
3. COMPARATIVE RESULTS BY SURVEY VERSION
This section presents a summary of comparative results for each CG-CAHPS survey version included in the 2015 CG-CAHPS Database. Results are presented in the form of bar charts that graphically show the distribution of scores for the core composites, individual question items, provider ratings, and supplemental composites where applicable. Users can compare their own results to the relevant bar charts, in order to identify performance strengths as well as opportunities for improvement.
The bar charts are composed of colored segments that show the percentage of responses in each of the response categories. For questions and composites based on 4-point response scales (i.e., "always", "usually", "sometimes”, "never"), the left-most segment combines the two lowest response categories (i.e., "sometimes" and "never").
Results also are presented by State and provider specialty for survey versions with sufficient data. Trend data for available years are presented for each version except for the Adult Survey 3.0, since 2015 was the first year of data collection for this new survey version.
All results presented in these charts are calculated at the respondent level. Survey results are presented in the following order:
- Adult Survey 2.0 Combined
- Child Survey 2.0 Combined
- Adult Visit Survey 2.0
- Adult Survey 3.0
As noted earlier, detailed results are available through the CG-CAHPS Database Online Reporting System at https://www.cahpsdatabase.ahrq.gov/CAHPSIDB/Public/CG/CG_About.aspx.
Adult Survey 2.0 Combined
(Adult 12/6-Month Survey 2.0 with/without PCMH Items)
|
| Composite/Item | | Never + Sometimes | Usually | Always |
|  |
|
|
|
|
|
N |
|
| Getting Timely Appointments, Care, and Information | | | |
|
414,810 |
| Got appointment for urgent care as soon as needed | | | |
|
168,526 |
| Got appointment for check-up or routine care as soon as needed | | | |
|
280,131 |
| Got answer to phone question during regular office hours on same day | | | |
|
148,300 |
| Got answer to phone question after hours as soon as needed | | | |
|
27,066 |
| Saw provider within 15 minutes of appointment time | | | |
|
407,740 |
|
|
| Composite/Item | | Never + Sometimes | Usually | Always |
| |
|
|
|
|
|
N |
|
| How Well Providers Communicate With Patients | | | |
|
413,547 |
| Provider explained things clearly | | | |
|
410,450 |
| Provider listened carefully | | | |
|
409,751 |
| Provider gave easy to understand information on health questions or concerns | | | |
|
342,267 |
| Provider knew important information about your medical history | | | |
|
405,908 |
| Provider showed respect | | | |
|
409,279 |
| Provider spent enough time | | | |
|
408,377 |
|
|
| Composite/Item | | |
|
|
|
|
|
N |
|
| Providers Pay Attention to Your Mental or Emotional Health (PCMH) | | | |
|
109,893 |
| Provider asked if there was a period of time when respondent felt sad, empty, or depressed | | | |
|
108,575 |
| Talked with provider about things causing worry or stress | | | |
|
108,150 |
| Talked with provider about personal problem, family, alcohol or drug use | | | |
|
108,024 |
|
|
| Composite/Item | | |
|
|
|
|
|
N |
|
| Providers Support You in Taking Care of Your Own Health (PCMH) | | | |
|
110,867 |
| Provider talked about specific goals | | | |
|
109,298 |
| Provider asked if there are things making it hard to take care of health | | | |
|
108,132 |
|
|
| Composite/Item | | No + Not at all | A little + Some | Yes + A lot |
| |
|
|
|
|
|
N |
|
| Providers Discuss Medication Decisions (PCMH) | | | |
|
53,715 |
| Provider talked about reasons to take a medicine | | | |
|
52,475 |
| Provider talked about reasons not to take a medicine | | | |
|
52,073 |
| Provider asked what respondent thought was best regarding medicine | | | |
|
51,786 |
|
|
| Individual Items |
| Never + Sometimes | Usually | Always |
| |
|
|
|
|
|
N |
|
| Days waited for an appointment for urgent care | | | |
|
45,172 |
| Got needed care during evenings, weekends, or holidays | | | |
|
12,460 |
| Provider was informed and up-to-date on care received from specialist | | | |
|
62,820 |
| Talked about prescription medicines at each visit | | | |
|
97,253 |
| Provider's office gave information on what to do if care needed on evenings, weekends, or holidays | | | |
|
101,745 |
| Got reminders from provider's office between visits | | | |
|
107,517 |
| Provider's office followed up with test results |
|
|
|
|
277,881 |
|
|
| Rating | | |
|
|
|
|
|
N |
|
| Rating of provider | | | |
|
405,483 |
|
Back To Top
Table 3. Comparison of Adult Survey 2.0 Combined Top-Box Scores by State
|
State
|
N |
Access |
Provider Communication |
Office Staff |
Patients' Rating of the Provider |
| CAHPS DB Overall |
418,901
|
63%
|
85%
|
81%
|
82%
|
| Alabama |
306
|
65%
|
81%
|
88%
|
90%
|
| Arizona |
6,358
|
59%
|
86%
|
81%
|
84%
|
| Arkansas |
13,012
|
59%
|
84%
|
79%
|
82%
|
| California |
82,067
|
58%
|
81%
|
74%
|
75%
|
| Colorado |
11,458
|
61%
|
84%
|
80%
|
82%
|
| Connecticut |
423
|
59%
|
82%
|
83%
|
77%
|
| Florida |
19,882
|
63%
|
86%
|
83%
|
83%
|
| Illinois |
13,134
|
59%
|
85%
|
79%
|
83%
|
| Kentucky |
1623
|
70%
|
88%
|
85%
|
83%
|
| Maine |
76,671
|
67%
|
86%
|
84%
|
83%
|
| Massachusetts |
19,727
|
68%
|
87%
|
81%
|
84%
|
| Minnesota |
25,511
|
55%
|
82%
|
74%
|
78%
|
| Montana |
8,451
|
59%
|
83%
|
83%
|
79%
|
| Mississippi |
2,301
|
71%
|
90%
|
84%
|
86%
|
| Nebraska |
2,893
|
66%
|
86%
|
80%
|
84%
|
| New Hampshire |
37,756
|
66%
|
88%
|
84%
|
85%
|
| New York |
8,346
|
66%
|
86%
|
82%
|
83%
|
| North Carolina |
8,696
|
71%
|
87%
|
86%
|
85%
|
| Ohio |
6,657
|
67%
|
86%
|
86%
|
86%
|
| Oklahoma |
4,656
|
65%
|
88%
|
82%
|
86%
|
| Oregon |
1,533
|
57%
|
82%
|
79%
|
79%
|
| Pennsylvania |
6,483
|
60%
|
84%
|
78%
|
80%
|
| Tennessee |
3,500
|
65%
|
88%
|
83%
|
87%
|
| Texas |
7,688
|
59%
|
84%
|
80%
|
83%
|
| Virginia |
6,152
|
64%
|
85%
|
84%
|
83%
|
| West Virginia |
963
|
66%
|
84%
|
84%
|
82%
|
| Wisconsin |
32,818
|
70%
|
88%
|
87%
|
87%
|
When reporting comparison scores by State, State with fewer than five practices and/or fewer than 300 completed surveys are not shown.
Table 4. Comparison of Adult Survey 2.0 Combined Top-Box Scores by Specialty
|
State
|
N |
Access |
Provider Communication |
Office Staff |
Patients' Rating of the Provider |
| CAHPS DB Overall |
418,901
|
63%
|
85%
|
81%
|
82%
|
| Allergy/Immunology |
1,237
|
63%
|
84%
|
81%
|
77%
|
| Cardiology |
9,821
|
68%
|
87%
|
84%
|
86%
|
| Dermatology |
8,709
|
65%
|
85%
|
83%
|
81%
|
| Endocrinology |
7,345
|
63%
|
86%
|
80%
|
82%
|
| Family Practice |
90,357
|
59%
|
84%
|
78%
|
80%
|
| Gastroenterology |
9,066
|
62%
|
83%
|
80%
|
79%
|
| General Practice |
1,694
|
64%
|
89%
|
80%
|
85%
|
| Hematology/Oncology |
14,178
|
68%
|
87%
|
86%
|
87%
|
| Internal Medicine |
61,077
|
62%
|
85%
|
79%
|
81%
|
| Neurology |
10,954
|
58%
|
82%
|
80%
|
78%
|
| OB/GYN |
20,546
|
65%
|
86%
|
77%
|
82%
|
| Ophthalmology |
8,446
|
65%
|
83%
|
81%
|
82%
|
| Orthopedics |
13,197
|
66%
|
84%
|
83%
|
83%
|
| Pediatrics |
809
|
59%
|
87%
|
79%
|
85%
|
| Physical Medicine & Rehabilitation |
2,213
|
60%
|
82%
|
81%
|
79%
|
| Podiatry |
772
|
63%
|
83%
|
79%
|
77%
|
| Psychiatry |
1,052
|
60%
|
86%
|
81%
|
82%
|
| Pulmonary Medicine |
4,431
|
65%
|
88%
|
86%
|
84%
|
| Radiology |
651
|
62%
|
83%
|
75%
|
81%
|
| Rheumatology |
10,179
|
67%
|
86%
|
84%
|
85%
|
| Surgery |
21,549
|
69%
|
86%
|
83%
|
83%
|
| Urology |
6,134
|
64%
|
85%
|
82%
|
82%
|
When reporting comparison scores by specialty, specialties with fewer than five practices and/or fewer than 300 completed surveys are not shown.
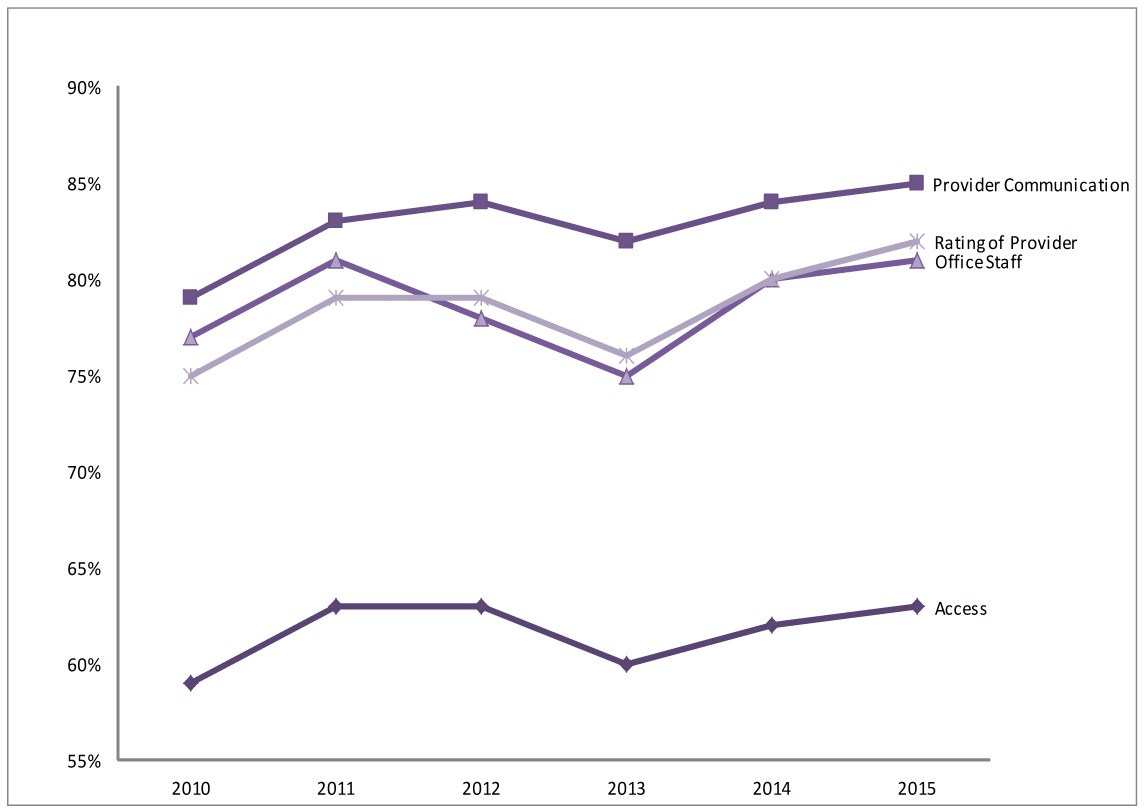
* Scores for 2010-2012 do not include results from the Adult PCMH version.
Horizontal bar graph comparing Adult Survey 2.0 Combined Top box scores over time.
Table 5. Number of Adult CG-CAHPS Survey Respondents and Practice Sites, 2010-2015
|
Year (Version)
|
Child Survey 2.0 Combined |
|
Number of Practice Sites
|
Number of Respondents |
| 2015 (2.0) |
1,935
|
418,901
|
| *2014 (2.0) |
2,291
|
457,418
|
| 2013 (2.0) |
833
|
199,038
|
| 2012 (2.0) |
286
|
100,527
|
| 2011 (1.0) |
519
|
52,434
|
| 2010 (1.0) |
234
|
41,834
|
* Numbers for 2010-2012 do not include the Adult PCMH version.
Child Survey 2.0 Combined
(Child 12/6-Month Survey 2.0 with/without PCMH Items)
|
| Composite/Item | | Never + Sometimes | Usually | Always |
| |
|
|
|
|
|
N |
|
| Getting Timely Appointments, Care, and Information | | | |
|
26,120 |
| Got appointment for urgent care as soon as needed | | | |
|
11,483 |
| Got appointment for check-up or routine care as soon as needed | | | |
|
18,592 |
| Got answer to phone question during regular office hours on same day | | | |
|
11,273 |
| Got answer to phone question after hours as soon as needed | | | |
|
3,386 |
| Saw provider within 15 minutes of appointment time | | | |
|
25,649 |
|
|
| Composite/Item | | Never + Sometimes | Usually | Always |
| |
|
|
|
|
|
N |
|
| How Well Providers Communicate With Patients | | | |
|
25,992 |
| Provider explained things clearly | | | |
|
25,841 |
| Provider listened carefully | | | |
|
25,851 |
| Provider gave easy to understand information on health questions or concerns | | | |
|
21,469 |
| Provider knew important information about your child's medical history | | | |
|
25,575 |
| Provider showed respect | | | |
|
25,704 |
| Provider spent enough time | | | |
|
25,632 |
|
|
| Composite/Item | | Never + Sometimes | Usually | Always |
| |
|
|
|
|
|
N |
|
| Helpful, Courteous, and Respectful Office Staff | | | |
|
25,444 |
| Office staff was helpful | | | |
|
25,309 |
| Office staff courteous and respectful | | | |
|
25,355 |
|
|
| Composite/Item | | |
|
|
|
|
|
N |
|
| Provider's Attention to Your Child's Growth and Development | | | |
|
22,852 |
| Spoke with provider's office about child's learning ability | | | |
|
22,566 |
| Spoke with provider's office about normal behaviors | | | |
|
22,620 |
| Spoke with provider's office about child's growth | | | |
|
22,621 |
| Spoke with provider's office about child's moods and emotions | | | |
|
22,569 |
| Spoke with provider's office about time spent on the computer or watching TV | | | |
|
22,550 |
| Spoke with provider's office about child's ability to get along with others | | | |
|
22,488 |
|
|
| Composite/Item | | |
|
|
|
|
|
N |
|
| Provider's Advice on Keeping Your Child Safe and Healthy | | | |
|
22,798 |
| Spoke with provider's office about ways to prevent injuries | | | |
|
22,552 |
| Received information about preventing injuries | | | |
|
22,461 |
| Spoke with provider's office about child's diet | | | |
|
22,577 |
| Spoke with provider's office about child's exercise | | | |
|
22,544 |
| Spoke with provider's office about household problems affecting the child | | | |
|
22,489 |
|
|
| Composite/Item | | |
|
|
|
|
|
N |
|
| Providers Support You in Taking Care of Your Child's Health (PCMH) | | | |
|
12,130 |
| Provider talked about specific goals | | | |
|
12,042 |
| Provider asked if there are things making it hard to take care of health | | | |
|
12,026 |
|
|
| Individual Items |
| Never + Sometimes | Usually | Always |
|
|
|
|
|
|
|
N |
|
| Days waited for an appointment for urgent care | | | |
|
5,494 |
| Got needed care during evenings, weekends, or holidays | | | |
|
2,122 |
| Provider was informed and up-to-date on care received from specialist | | | |
|
3,676 |
| Talked about prescription medicines at each visit | | | |
|
6,245 |
| Provider's office gave information on what to do if care needed on evenings, weekends, or holidays | | | |
|
11,895 |
| Got reminders from provider's office between visits | | | |
|
12,094 |
| Provider's office followed up with test results |
|
|
|
|
8,175 |
|
|
| Rating | | |
|
|
|
|
|
N |
|
| Rating of provider | | | |
|
25,383 |
|
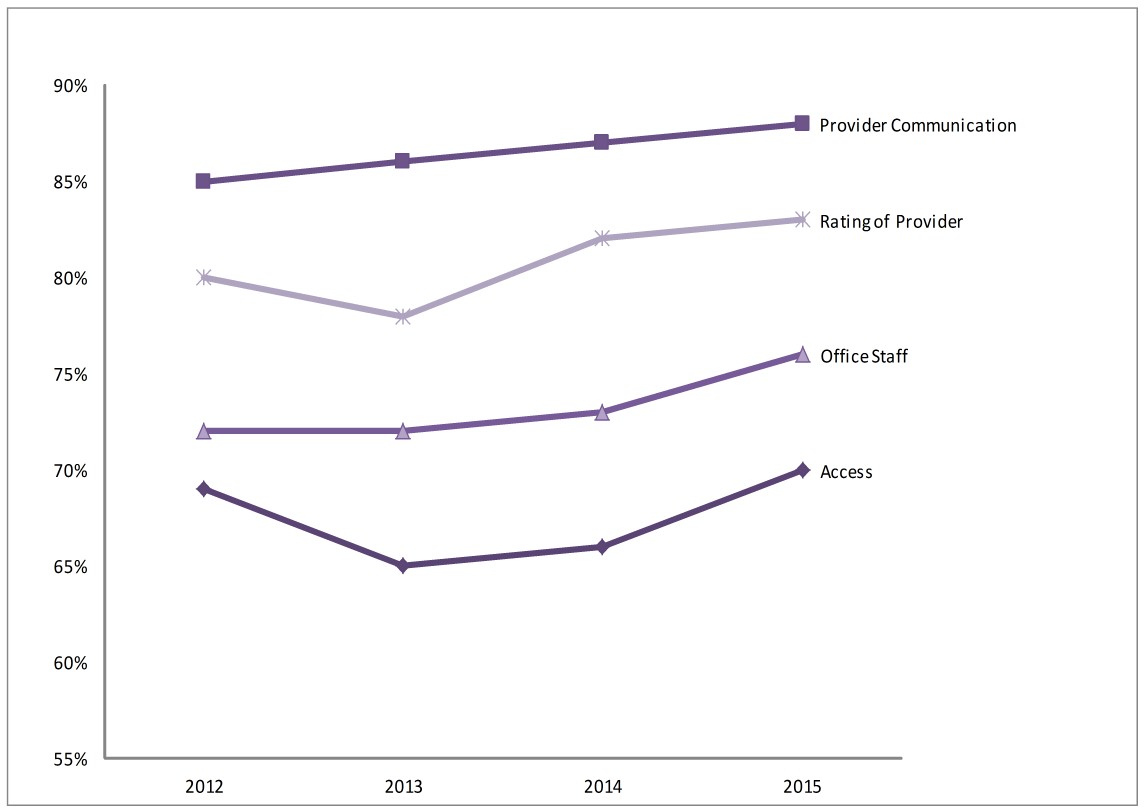
Horizontal bar graph comparing Child Survey 2.0 Combined Top box scores over time.
Table 6. Number of Child Survey 2.0 Combined Respondents and Practice Sites, 2012-2015
|
Year (Version)
|
Child Survey 2.0 Combined |
|
Number of Practice Sites
|
Number of Respondents |
| 2015 (2.0) |
247
|
26,364
|
| 2014 (2.0) |
341
|
28,925
|
| 2013 (2.0) |
105
|
8,265
|
| 2012 (2.0) |
58
|
3,276
|
Adult Visit Survey 2.0
|
| Composite/Item | | Never + Sometimes | Usually | Always |
| |
|
|
|
|
|
N |
|
| Getting Timely Appointments, Care, and Information | | | |
|
164,342 |
| Got appointment for urgent care as soon as needed | | | |
|
63,787 |
| Got appointment for check-up or routine care as soon as needed | | | |
|
114,197 |
| Got answer to phone question during regular office hours on same day | | | |
|
59,182 |
| Got answer to phone question after hours as soon as needed | | | |
|
11,314 |
| Saw provider within 15 minutes of appointment time | | | |
|
160,716 |
|
|
| Composite/Item | | No | Yes, somewhat | Yes, definitely |
| |
|
|
|
|
|
N |
|
| How Well Providers Communicate With Patients | | | |
|
164,029 |
| Provider explained things clearly | | | |
|
160,373 |
| Provider listened carefully | | | |
|
162,966 |
| Provider gave easy to understand information on health questions or concerns | | | |
|
139,934 |
| Provider knew important information about your medical history | | | |
|
162,485 |
| Provider showed respect | | | |
|
163,265 |
| Provider spent enough time | | | |
|
163,025 |
|
|
| Composite/Item | | No | Yes, somewhat | Yes, definitely |
| |
|
|
|
|
|
N |
|
| Helpful, Courteous, and Respectful Office Staff | | | |
|
163,555 |
| Office staff was helpful | | | |
|
162,526 |
| Office staff courteous and respectful | | | |
|
163,051 |
|
|
| Individual Items | | |
|
|
|
|
|
N |
|
| Provider's office followed up with test results | | | |
|
77,906 |
| | No | Yes, somewhat | Yes, definitely |
| |
|
|
|
|
|
N |
|
| Would you recommend this provider's office | | | |
|
161,561 |
|
|
| Rating | | |
|
|
|
|
|
N |
|
| Rating of provider | | | |
|
161,889 |
|
Table 7. Comparison of Adult Visit Survey 2.0 by State
|
State
|
N |
Access |
Provider Communication |
Office Staff |
Patients' Rating of the Provider |
| CAHPS DB Overall |
166,266
|
62%
|
91%
|
92%
|
83%
|
| Arizona |
8,441
|
55%
|
90%
|
89%
|
82%
|
| Colorado |
50,624
|
62%
|
91%
|
92%
|
83%
|
| Idaho |
9,613
|
65%
|
93%
|
93%
|
86%
|
| Illinois |
4,003
|
66%
|
92%
|
94%
|
83%
|
| Indiana |
27,091
|
62%
|
91%
|
92%
|
84%
|
| Iowa |
1,506
|
58%
|
90%
|
90%
|
81%
|
| Maine |
3,070
|
69%
|
92%
|
96%
|
83%
|
| Minnesota |
1,732
|
59%
|
89%
|
95%
|
79%
|
| Montana |
13,303
|
65%
|
93%
|
93%
|
85%
|
| Ohio |
2,364
|
70%
|
93%
|
95%
|
84%
|
| Pennsylvania |
19,639
|
62%
|
91%
|
91%
|
81%
|
| Washington |
17,768
|
57%
|
91%
|
92%
|
82%
|
| Wisconsin |
4,667
|
71%
|
89%
|
93%
|
81%
|
When reporting comparison scores by State, State with fewer than five practices and/or fewer than 300 completed surveys are not shown.
Table 8. Comparison of Adult Visit Survey 2.0 by Specialty
|
State
|
N |
Access |
Provider Communication |
Office Staff |
Patients' Rating of the Provider |
| CAHPS DB Overall |
166,266
|
62%
|
91%
|
92%
|
83%
|
| Cardiology |
4,288
|
70%
|
94%
|
95%
|
87%
|
| Dermatology |
3,151
|
61%
|
89%
|
92%
|
81%
|
| Endocrinology |
3,382
|
58%
|
91%
|
93%
|
82%
|
| Family Practice |
33,923
|
59%
|
92%
|
92%
|
2%
|
| Gastroenterology |
5,102
|
62%
|
89%
|
93%
|
80%
|
| Hematology/Oncology |
4,856
|
71%
|
93%
|
93%
|
87%
|
| Internal Medicine |
16,557
|
60%
|
93%
|
93%
|
84%
|
| Neurology |
7,667
|
49%
|
89%
|
90%
|
79%
|
| OB/GYN |
4,095
|
65%
|
91%
|
89%
|
82%
|
| Ophthalmology |
6,199
|
66%
|
92%
|
93%
|
83%
|
| Orthopedics |
2,888
|
63%
|
89%
|
92%
|
83%
|
| Physical Medicine & Rehabilitation |
2,139
|
62%
|
93%
|
89%
|
86%
|
| Pulmonary Medicine |
399
|
61%
|
93%
|
95%
|
83%
|
| Radiology |
832
|
61%
|
90%
|
91%
|
82%
|
| Rheumatology |
3,806
|
61%
|
91%
|
92%
|
86%
|
| Surgery |
9,106
|
67%
|
92%
|
92%
|
86%
|
| Urology |
2,541
|
64%
|
91%
|
92%
|
83%
|
When reporting comparison scores by specialty, specialties with fewer than five practices and/or fewer than 300 completed surveys are not shown.
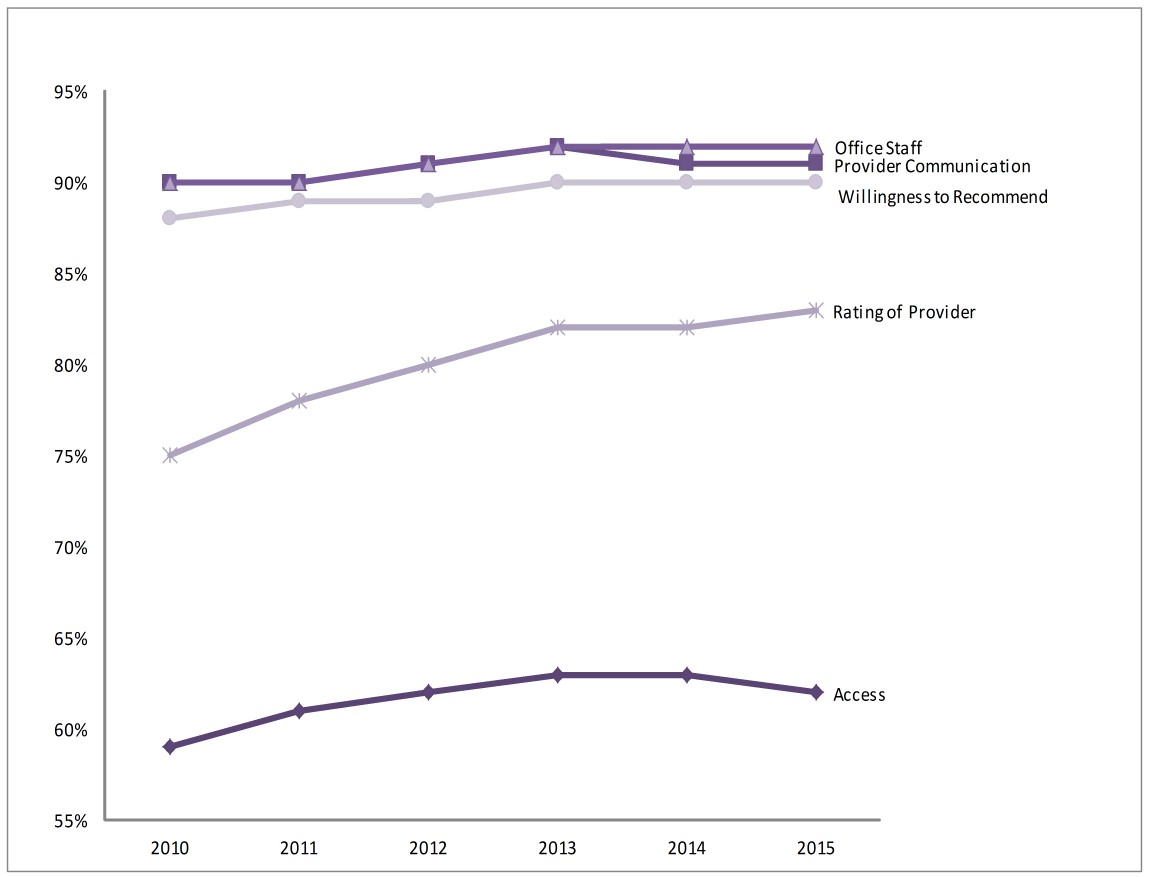
Horizontal bar graph comparing Adult Visit Survey 2.0 Top box scores over time.
Table 9. Number of Adult Visit Survey Respondents and Practice Sites, 2010-2015
|
Year (Version)
|
Adult Visit |
|
Number of Practice Sites
|
Number of Respondents |
| 2015 (2.0) |
490
|
166,266
|
| 2014 (2.0) |
1,330
|
312,624
|
| 2013 (2.0) |
1,234
|
428,154
|
| 2012 (2.0) |
1,718
|
613,396
|
| 2011 (1.0) |
769
|
266,327
|
| 2010 (1.0) |
469
|
103,442
|
Adult Survey 3.0
|
| Composite/Item | | Never + Sometimes | Usually | Always |
| |
|
|
|
|
|
N |
|
| Getting Timely Appointments, Care, and Information | | | |
|
21,614 |
| Got appointment for urgent care as soon as needed | | | |
|
10,022 |
| Got appointment for check-up or routine care as soon as needed | | | |
|
17,832 |
| Got answer to phone question during regular office hours on same day | | | |
|
9,240 |
|
|
| Composite/Item | | Never + Sometimes | Usually | Always |
| |
|
|
|
|
|
N |
|
| How Well Providers Communicate With Patients | | | |
|
24,525 |
| Provider explained things clearly | | | |
|
24,406 |
| Provider listened carefully | | | |
|
24,337 |
| Provider showed respect | | | |
|
24,307 |
| Provider spent enough time | | | |
|
23,900 |
|
|
| Composite/Item | | Never + Sometimes | Usually | Always |
| |
|
|
|
|
|
N |
|
| Helpful, Courteous, and Respectful Office Staff | | | |
|
23,628 |
| Office staff was helpful | | | |
|
23,568 |
| Office staff courteous and respectful | | | |
|
23,375 |
|
|
| Composite/Item | | Never + Sometimes | Usually | Always |
| |
|
|
|
|
|
N |
|
| Providers' Use of Information to Coordinate Patient Care | | | |
|
24,453 |
| Provider knew important information about your medical history | | | |
|
24,217 |
| Provider's office followed up with test results | | | |
|
16,768 |
| Talked about prescription medicines at each visit | | | |
|
20,321 |
|
|
| Rating | | |
|
|
|
|
|
N |
|
| Rating of provider | | | |
|
23,417 |
|
Back To Top
Appendix A. CHARACTERISTICS OF THE 2015 CG-CAHPS DATABASE
When reviewing the CAHPS Clinician & Group (CG-CAHPS) Survey results, it is helpful as context to understand the types of practice sites that make up the comparative results for all versions of the survey.
The CAHPS Database asked each submitter to provide information about their practices (i.e., “practice site characteristics”) along with their survey responses. It is important to note that participating practice sites voluntarily submit data to the CAHPS Database and therefore do not constitute a representative sample of all medical practices in the United States. However, users can compare their results to similar organizations using the reported practice site characteristics.
The practice site characteristics collected by the CAHPS Database include region, practice ownership and affiliation, and providers working per week. Survey completion mode was reported at the respondent level.
Table A-1. Composition of the 2015 CG-CAHPS Database
|
Survey Version
|
CG-CAHPS Database |
|
Number of Practice Sites
|
Number of Respondents |
| Adult Survey 2.0 Combined |
1,935
|
418,901
|
| Child Survey 2.0 Combined |
247
|
26,364
|
| Adult Visit Survey 2.0 |
490
|
166,266
|
| Adult Survey 3.0 |
157
|
24,937
|
| Total |
2,829
|
636,468
|
Region
The distribution of regions is shown in Table A-2. Each version of the CG-CAHPS Survey reflects a different regional distribution and is not representative of the U.S. distribution. The largest concentration of practice sites for the Adult Survey 2.0 Combined was from the Northeast. The largest concentration for the Adult Visit 2.0 survey was from the West, and for Child Survey 2.0 Combined, most practice sites were from the Northeast. Practice sites were assigned to one of the four U.S. Census Bureau’s regions, based on the practice sites’ self-reported State and ZIP code information 1.
1 NOTE: States are categorized into U.S. Census Bureau-defined regions as follows:
Northeast: CT, MA, ME, NH, NJ, NY, PA, PR, RI, VT
Midwest: IA, IL, IN, KS, MI, MN, MO, NE, ND, OH, SD, WI
West: AK, AZ, CA, CO, GU, HI, ID, MT, NM, NV, OR, UT, WA, WY
South: AL, AR, DC, DE, FL, GA, KY, LA, MD, MS, NC, OK, SC, TN, TX, VA, WV
Table A-2. Distribution of Practice Sites and Survey Respondents by Region
|
Region
|
Number |
Adult 2.0 Combined |
Child 2.0 Combined |
Adult Visit 2.0 |
Adult 3.0 |
| Midwest |
Practice Sites
|
509
|
63
|
117
|
51
|
|
Respondents
|
98,190
|
7,490
|
41,413
|
6,791
|
| Northeast |
Practice Sites
|
740
|
129
|
125
|
22
|
|
Respondents
|
155,194
|
11,248
|
23,435
|
195
|
| West |
Practice Sites
|
312
|
42
|
6
|
75
|
|
Respondents
|
60,161
|
4,045
|
1,196
|
16,803
|
| West |
Practice Sites
|
374
|
13
|
242
|
9
|
|
Respondents
|
105,356
|
3,581
|
100,222
|
1,148
|
| Total |
Practice Sites
|
1,935
|
247
|
490
|
157
|
|
Respondents
|
418,901
|
26,364
|
166,266
|
24,937
|
Back To Top
Practice Ownership and Affiliation
The distribution of the practice ownership and affiliation categories is shown in style="text-align:right;" The largest number of practice sites was “Hospital/Health System” across all survey versions, followed by “Provider/Physician.” In addition, some of the categories are not mutually exclusive and could therefore misrepresent the true distribution among the practice sites included in the database.
Table A-3. Distribution of Practice Sites and Survey Respondents by Practice Site Ownership and Affiliation
|
Practice Ownership and Affiliation
|
Number |
Adult 2.0 Combined |
Child 2.0 Combined |
Adult Visit 2.0 |
Adult 3.0 |
| Provider/Physician |
Practice Sites
|
485
|
48
|
75
|
62
|
|
Respondents
|
99,524
|
6,512
|
40,411
|
6,159
|
| Hospital/Health System |
Practice Sites
|
1,088
|
173
|
286
|
95
|
|
Respondents
|
251,820
|
15,354
|
99,528
|
18,778
|
| University/ Academic Med Center |
Practice Sites
|
199
|
21
|
45
|
0
|
|
Respondents
|
46,178
|
3,961
|
9,763
|
0
|
| Community Health Center |
Practice Sites
|
114
|
4
|
58
|
0
|
|
Respondents
|
14,431
|
369
|
13,643
|
0
|
| Other |
Practice Sites
|
49
|
1
|
26
|
0
|
|
Respondents
|
6,948
|
168
|
2,891
|
0
|
| Total |
Practice Sites
|
1,935
|
247
|
490
|
157
|
|
Respondents
|
418,901
|
26,364
|
166,266
|
24,937
|
Providers Working per Week
As a proxy measure for practice size, the distribution of the number of providers working per week is shown in Table A-4. This information was self-reported at the practice-site level. Other than “missing,” most practice sites that voluntarily submitted their data to the CAHPS Database have 4 to 9 providers (e.g., doctors of medicine, doctors of osteopathic medicine, physician assistants, nurse practitioners, etc.) working during a typical week.
Table A-4. Distribution of Practice Sites and Survey Respondents by Number of Providers Working per Week
|
Number of Providers Working per Week
|
Number |
Adult 2.0 Combined |
Child 2.0 Combined |
Adult Visit 2.0 |
Adult 3.0 |
| Missing |
Practice Sites
|
1,079
|
163
|
417
|
24
|
|
Respondents
|
264,968
|
14,012
|
153,193
|
13,737
|
| 1 provider |
Practice Sites
|
114
|
5
|
15
|
13
|
|
Respondents
|
6,400
|
237
|
453
|
96
|
| 2 - 3 providers |
Practice Sites
|
223
|
21
|
25
|
37
|
|
Respondents
|
24,941
|
2,259
|
2,433
|
1,128
|
| 4 - 9 providers |
Practice Sites
|
297
|
28
|
24
|
53
|
|
Respondents
|
55,693
|
4,507
|
4,889
|
3,549
|
| 10 - 13 providers |
Practice Sites
|
76
|
6
|
5
|
15
|
|
Respondents
|
21,499
|
509
|
2,532
|
2,373
|
| 14 - 19 providers |
Practice Sites
|
46
|
13
|
1
|
9
|
|
Respondents
|
13,396
|
2,439
|
469
|
1,953
|
| More than 20 providers |
Practice Sites
|
100
|
11
|
3
|
6
|
|
Respondents
|
32,004
|
2,401
|
2,297
|
2,101
|
| Total |
Practice Sites
|
1,935
|
247
|
490
|
157
|
|
Respondents
|
418,901
|
26,364
|
166,266
|
24,937
|
Survey Completion Mode
As shown in Table A-5, the vast majority of the surveys submitted to the CAHPS Database were completed by mail. Web/Internet survey mode accounted for the second largest number of survey completes.
Table A-5. Distribution of Practice Sites and Survey Respondents by Survey Completion Mode
|
Survey Completion Mode
|
Number |
Adult 2.0 Combined |
Child 2.0 Combined |
Adult Visit 2.0 |
Adult 3.0 |
| Mail |
Practice Sites
|
1,539
|
211
|
431
|
63
|
|
Respondents
|
308,542
|
20,681
|
156,052
|
14,950
|
| Phone |
Practice Sites
|
456
|
17
|
25
|
0
|
|
Respondents
|
19,159
|
1,799
|
2,456
|
0
|
| IVR |
Practice Sites
|
228
|
18
|
0
|
0
|
|
Respondents
|
50,515
|
3,345
|
0
|
0
|
| Web/Internet |
Practice Sites
|
683
|
49
|
78
|
100
|
|
Respondents
|
39,999
|
513
|
7,483
|
9,978
|
APPENDIX B. LISTING OF COMPOSITES, RATINGS, AND INDIVIDUAL ITEMS BY SURVEY VERSION
The following tables present the question wording and response options for the composites, ratings, and individual items included in the Adult and Child versions of the CAHPS Clinician & Group Survey.
Table B-1. Adult Survey 2.0 Combined
|
Getting Timely Appointments, Care, and Information
|
| Q6 |
In the last 12/6 months, when you phoned this provider’s office to get an appointment for care you needed right away, how often did you get an appointment as soon as you needed?
|
Response Options
- Never
- Sometimes
- Usually
- Always
|
| Q8/Q9 |
In the last 12/6 months, when you made an appointment for a check-up or routine care with this provider, how often did you get an appointment as soon as you needed?
|
| Q10/Q14 |
In the last 12/6 months, when you phoned this provider’s office during regular office hours, how often did you get an answer to your medical question that same day?
|
| Q12/Q16 |
In the last 12/6 months, when you phoned this provider’s office after regular office hours, how often did you get an answer to your medical question as soon as you needed?
|
| Q13/Q18 |
Wait time includes time spent in the waiting room and exam room. In the last 12/6 months, how often did you see this provider within 15 minutes of your appointment time?
|
|
How Well Providers Communicate With Patients
|
| Q14/Q19 |
In the last 12/6 months, how often did this provider explain things in a way that was easy to understand?
|
Response Options
- Never
- Sometimes
- Usually
- Always
|
| Q15/Q20 |
In the last 12/6 months, how often did this provider listen carefully to you?
|
| Q17/Q22 |
In the last 12/6 months, how often did this provider give you easy to understand information about these health questions or concerns?
|
| Q18/Q23 |
In the last 12/6 months, how often did this provider seem to know the important information about your medical history?
|
| Q19/Q24 |
In the last 12/6 months, how often did this provider show respect for what you had to say?
|
| Q20/Q25 |
In the last 12/6 months, how often did this provider spend enough time with you?
|
|
Helpful, Courteous, and Respectful Office Staff
|
| Q24/Q42 |
In the last 12/6 months, how often were clerks and receptionists at this provider’s office as helpful as you thought they should be?
|
Response Options
- Never
- Sometimes
- Usually
- Always
|
| Q25/Q43 |
In the last 12/6 months, how often did clerks and receptionists at this provider’s office treat you with courtesy and respect?
|
|
Follow-up on Test Results
|
| Q22/Q27 |
In the last 12/6 months, when this provider ordered a blood test, x-ray, or other test for you, how often did someone from this provider’s office to give you those results?
|
Response Options
- Never
- Sometimes
- Usually
- Always
|
|
Patients’ Rating of the Provider
|
| Q23/Q32 |
Using any number from 0 to 10, where 0 is the worst provider possible and 10 is the best provider possible, what number would you use to rate this provider?
|
Response Options
|
|
Providers Pay Attention to Your Mental or Emotional Health (PCMH)
|
| Q39 |
In the last 12/6 months, did anyone in this provider’s office ask you if there was a period of time when you felt sad, empty, or depressed?
|
Response Options
|
| Q40 |
In the last 12/6 months, did you and anyone in this provider’s office talk about things in your life that worry you or cause you stress?
|
| Q41 |
In the last 12/6 months, did you and anyone in this provider’s office talk about a personal problem, family problem, alcohol use, drug use, or a mental or emotional illness?
|
|
Providers Support You in Taking Care of Your Own Health (PCMH)
|
| Q35 |
In the last 12/6 months, did anyone in this provider’s office talk with you about specific goals for your health?
|
Response Options
|
| Q36 |
In the last 12/6 months, did anyone in this provider’s office ask you if there are things that make it hard for you to take care of your health?
|
|
Providers Discuss Medication Decisions (PCMH)
|
| Q29 |
When you talked about starting or stopping a prescription medicine, how much did this provider talk about the reasons you might want to take a medicine?
|
Response Options
- Not at all
- A little
- Some
- A lot
|
| Q30 |
When you talked about starting or stopping a prescription medicine, how much did this provider talk about the reasons you might not want to take a medicine?
|
| Q31 |
When you talked about starting or stopping a prescription medicine, did this provider ask you what you thought was best for you?
|
Response Options
|
|
Other Individual PCMH Items
|
|
Access to Care
|
| Q7 |
In the last 12/6 months, how many days did you usually have to wait for an appointment when you needed care right away?
|
Response Options
- Same day
- 1 day
- 2 to 3 days
- 4 to 7 days
- More than 7 days
|
| Q12 |
In the last 12/6 months, how often were you able to get the care you needed from this provider’s office during evenings, weekends, or holidays?
|
Response Options
- Never
- Sometimes
- Usually
- Always
|
|
Attention to Care From Other Providers
|
| Q34 |
In the last 12/6 months, how often did the provider named in Question 1 seem informed and up-to-date about the care you got from specialists?
|
Response Options
- Never
- Sometimes
- Usually
- Always
|
| Q38 |
In the last 12/6 months, did you and anyone in this provider’s office talk at each visit about all the prescription medicines you were taking?
|
Response Options
|
|
Information About Care and Appointments
|
| Q10 |
Did this provider’s office give you information about what to do if you needed care during evenings, weekends, or holidays?
|
Response Options
|
| Q17 |
Some offices remind patients between visits about tests, treatment or appointments. In the last 12/6 months, did you get any reminders from this provider’s office between visits?
|
Back To Top
Table B-2. Child Survey 2.0 Combined
|
Getting Timely Appointments, Care, and Information
|
| Q13 |
In the last 12/6 months, when you phoned this provider’s office to get an appointment for care your child needed right away, how often did you get an appointment as soon as your child needed?
|
Response Options
- Never
- Sometimes
- Usually
- Always
|
| Q15/Q16 |
In the last 12/6 months, when you made an appointment for a check-up or routine care for your child with this provider, how often did you get an appointment as soon as your child needed?
|
| Q17/Q21 |
In the last 12/6 months, when you phoned this provider’s office during regular office hours, how often did you get an answer to your medical question that same day?
|
| Q19/Q23 |
In the last 12/6 months, when you phoned this provider’s office after regular office hours, how often did you get an answer to your medical question as soon as you needed?
|
| Q20/Q25 |
Wait time includes time spent in the waiting room and exam room. In the last 12/6 months, how often did your child see this provider within 15 minutes of his or her appointment time?
|
|
How Well Providers Communicate With Patients
|
| Q21/Q26 |
In the last 12/6 months, how often did this provider explain things about your child’s health in a way that was easy to understand?
|
Response Options
- Never
- Sometimes
- Usually
- Always
|
| Q22/Q27 |
In the last 12/6 months, how often did this provider listen carefully to you?
|
| Q24/Q29 |
In the last 12/6 months, how often did this provider give you easy to understand information about these health questions or concerns?
|
| Q25/Q30 |
In the last 12/6 months, how often did this provider seem to know the important information about your child’s medical history?
|
| Q26/Q31 |
In the last 12/6 months, how often did this provider show respect for what you had to say?
|
| Q27/Q32 |
In the last 12/6 months, how often did this provider spend enough time with your child?
|
|
Helpful, Courteous, and Respectful Office Staff
|
| Q42/Q53 |
In the last 12/6 months, how often were clerks and receptionists at this provider’s office as helpful as you thought they should be?
|
Response Options
- Never
- Sometimes
- Usually
- Always
|
| Q43/Q54 |
In the last 12/6 months, how often did clerks and receptionists at this provider’s office treat you with courtesy and respect?
|
|
Provider’s Attention to Your Child’s Growth and Development
|
| Q31/Q38 |
In the last 12/6 months, did you and anyone in this provider’s office talk about your child’s learning ability?
|
Response Options
|
| Q32/Q39 |
In the last 12/6 months, did you and anyone in this provider’s office talk about the kinds of behaviors that are normal for your child at this age?
|
| Q33/Q40 |
In the last 12/6 months, did you and anyone in this provider’s office talk about how your child’s body is growing?
|
| Q34/Q41 |
In the last 12/6 months, did you and anyone in this provider’s office talk about your child’s moods and emotions?
|
| Q37/Q44 |
In the last 12/6 months, did you and anyone in this provider’s office talk about how much time your child spends on a computer and in front of a TV?
|
| Q40/Q47 |
In the last 12/6 months, did you and anyone in this provider’s office talk about how your child gets along with others?
|
|
Provider’s Advice on Keeping Your Child Safe and Healthy
|
| Q35/Q42 |
In the last 12/6 months, did you and anyone in this provider’s office talk about things you can do to keep your child from getting injured?
|
Response Options
|
| Q36/Q43 |
In the last 12/6 months, did anyone in this provider’s office give you information about how to keep your child from getting injured?
|
| Q38/Q45 |
In the last 12/6 months, did you and anyone in this provider’s office talk about how much or what kind of food your child eats?
|
| Q39/Q46 |
In the last 12/6 months, did you and anyone in this provider’s office talk about how much or what kind of exercise your child gets?
|
| Q41/Q48 |
In the last 12/6 months, did you and anyone in this provider’s office talk about whether there are any problems in your household that might affect your child?
|
|
Follow-up on Test Results
|
| Q29/Q34 |
In the last 12/6 months, when this provider ordered a blood test, x-ray, or other test for your child, how often did someone from this provider’s office follow up to give you those results?
|
Response Options
- Never
- Sometimes
- Usually
- Always
|
|
Patients’ Rating of the Provider
|
| Q30/Q35 |
Using any number from 0 to 10, where 0 is the worst provider possible and 10 is the best provider possible, what number would you use to rate this provider?
|
Response Options
|
|
Providers Support You in Taking Care of Your Own Health (PCMH)
|
| Q49 |
In the last 12/6 months, did anyone in this provider’s office talk with you about specific goals for your child’s health?
|
Response Options
|
| Q50 |
In the last 12/6 months, did anyone in this provider’s office ask you if there are things that make it hard for you to take care of your child’s heath?
|
|
Other Individual PCMH Items
|
|
Access Care
|
| Q14 |
In the last 12/6 months, how many days did you usually have to wait for an appointment when your child needed care right away?
|
Response Options
- Same day
- 1 day
- 2 to 3 days
- 4 to 7 days
- More than 7 days
|
| Q19 |
In the last 12/6 months, how often were you able to get the care your child needed from this provider’s office during evenings, weekends, or holidays?
|
Response Options
- Never
- Sometimes
- Usually
- Always
|
|
Attention to Care From Other Providers
|
| Q37 |
In the last 12/6 months, how often did the provider named in Question 1 seem informed and up-to-date about the care your child got from specialists?
|
Response Options
- Never
- Sometimes
- Usually
- Always
|
| Q52 |
In the last 12/6 months, did you and anyone in this provider’s office talk at each visit about all the prescription medicines your child was taking?
|
Response Options
|
|
Information About Care and Appointments
|
| Q17 |
Did this provider’s office give you information about what to do if your child needed care during evenings, weekends, or holidays?
|
Response Options
|
| Q24 |
Some offices remind patients between visits about tests, treatment, or appointments. In the last 12/6 months, did you get any reminders about your child’s care from this provider’s office between visits?
|
Back To Top
Table B-3. Adult Visit Survey 2.0
|
Getting Timely Appointments, Care, and Information
|
| Q6 |
In the last 12/6 months, when you phoned this provider’s office to get an appointment for care you needed right away, how often did you get an appointment as soon as you needed?
|
Response Options
- Never
- Sometimes
- Usually
- Always
|
| Q8 |
In the last 12/6 months, when you made an appointment for a check-up or routine care with this provider, how often did you get an appointment as soon as you needed?
|
| Q10 |
In the last 12/6 months, when you phoned this provider’s office during regular office hours, how often did you get an answer to your medical question that same day?
|
| Q12 |
In the last 12/6 months, when you phoned this provider’s office after regular office hours, how often did you get an answer to your medical question as soon as you needed?
|
| Q13 |
Wait time includes time spent in the waiting room and exam room. In the last 12/6 months, how often did you see this provider within 15 minutes of your appointment time?
|
|
How Well Providers Communicate With Patients
|
| Q16 |
During your most recent visit, did this provider explain things in a way that was easy to understand?
|
Response Options
- Yes, definitely
- Yes, somewhat
- No
|
| Q17 |
During your most recent visit, did this provider listen carefully to you?
|
| Q19 |
During your most recent visit, did this provider give you easy to understand information about these health questions or concerns?
|
| Q20 |
During your most recent visit, did this provider seem to know the important information about your medical history?
|
| Q21 |
During your most recent visit, did this provider show respect for what you had to say?
|
| Q22 |
During your most recent visit, did this provider spend enough time with you?
|
|
Helpful, Courteous, and Respectful Office Staff
|
| Q27 |
During your most recent visit, were clerks and receptionists at this provider’s office as helpful as you thought they should be?
|
Response Options
- Yes, definitely
- Yes, somewhat
- No
|
| Q28 |
During your most recent visit, did clerks and receptionists at this provider’s office treat you with courtesy and respect?
|
|
Follow-up on Test Results
|
| Q24 |
Did someone from this provider’s office follow up to give you those results?
|
Response Options
|
|
Patients’ Rating of the Provider
|
| Q25 |
Using any number from 0 to 10, where 0 is the worst provider possible and 10 is the best provider possible, what number would you use to rate this provider?
|
Response Options
|
|
Willingness to Recommend
|
| Q26 |
Would you recommend this provider’s office to your family and friends?
|
Response Options
- Yes, definitely
- Yes, somewhat
- No
|
Back To Top
Table B-4. Adult Survey 3.0
|
Getting Timely Appointments, Care and Information
|
| Q6 |
In the last 6 months, when you contacted this provider’s office to get an appointment for care you needed right away, how often did you get an appointment as soon as you needed?
|
Response Options
- Never
- Sometimes
- Usually
- Always
|
| Q8 |
In the last 6 months, when you made an appointment for a check-up or routine care with this provider, how often did you get an appointment as soon as you needed?
|
| Q10 |
In the last 6 months, when you made an appointment for a check-up or routine care with this provider, how often did you get an appointment as soon as you needed?
|
|
How Well Providers Communicate With Patients
|
| Q11 |
In the last 6 months, how often did this provider explain things in a way that was easy to understand?
|
Response Options
- Never
- Sometimes
- Usually
- Always
|
| Q12 |
In the last 6 months, how often did this provider listen carefully to you?
|
| Q14 |
In the last 6 months, how often did this provider show respect for what you had to say?
|
| Q15 |
In the last 6 months, how often did this provider spend enough time with you?
|
|
Providers' Use of Information to Coordinate Patient Care
|
| Q13 |
In the last 6 months, how often did this provider seem to know the important information about your medical history?
|
Response Options
- Never
- Sometimes
- Usually
- Always
|
| Q17 |
In the last 6 months, when this provider ordered a blood test, x-ray, or other test for you, how often did someone from this provider’s office follow up to give you those results?
|
| Q20 |
In the last 6 months, how often did you and someone from this provider’s office talk about all the prescription medicines you were taking?
|
|
Helpful, Courteous, and Respectful Office Staff
|
| Q21 |
In the last 6 months, how often were clerks and receptionists at this provider’s office as helpful as you thought they should be?
|
Response Options
- Never
- Sometimes
- Usually
- Always
|
| Q22 |
In the last 6 months, how often did clerks and receptionists at this provider’s office treat you with courtesy and respect?
|
|
Patients’ Rating of the Provider
|
| Q18 |
Using any number from 0 to 10, where 0 is the worst provider possible and 10 is the best provider possible, what number would you use to rate this provider?
|
Response Options
|